Hi,
In different occasions we have been asked to report on a specific measure/KPI, or to simulate a change in its value and see the impact on other elements of the screen, through a "slider" object (see image below as example). This kind of objects are getting widely spread into web-based applications due to their ease of use and immediate user feedback.
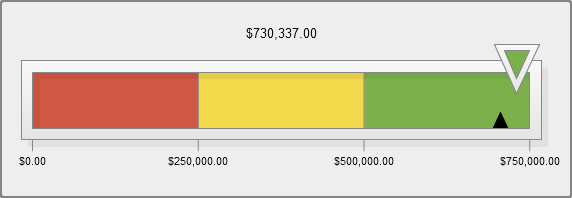
As a sample concept, in BOARD, an user could graphically "drag" a measure to a specific value and have an immediate feeling of the change on the other KPI indicators and dataviews around it.
In addition, there should be the possibility to set alert thresholds in the background of the slider, maybe set dynamically so that based on the specific selection / data on the screen, different users get different "feelings" based on the actual business situation.
At the moment, when absolutely needed / requested, we are able to create "simulated" sliders through a set of labels with procedures that when clicked, move values in cube around with dataflow. This object would greatly simplify the job and in my opinion it would be a very nice addition to the already rich BOARD visualization capabilities!
Any additional input on this is greatly appreciated!
Thanks
Michele

