Hello,
Is there a way to show the Top N clients, all clients in the middle, and Bottom N clients in a Waterfall chart? I can either show Top N or Bottom N clients but not both at the same time and also I am still missing the Mid-range
Hi @Efraim ,
there currently is no native way to achieve that. You'd have to precalculate the top/flop customers and use those values in the waterfall.
But the precalculation would have to be done each time the user changes the selection criteria on the screen, the top/flop need to be dynamic.
Best, Helmut
Thanks @Helmut Heimann ! For the precalculation, am I correct to assume it is to be done using Procedures?
yes, @Efraim , that's correct—you need to precalculate the cubes by procedure.
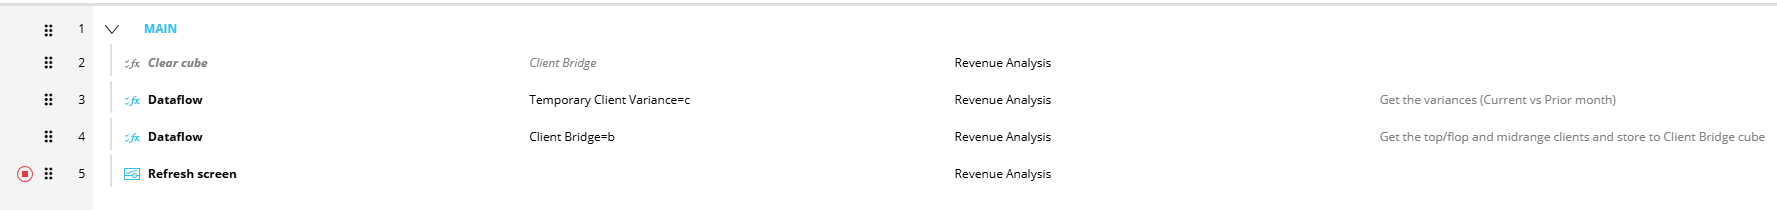
Hello @Helmut Heimann, thanks again for you answer here. I know this thread is already answered. Not sure if I need to create a new one. I am currently stuck on getting the top 3, flop 3 clients, and midrange. I was able to get the variances for each client (Current vs Prior Month) but I can't find a way of getting the top/flop clients based on variances. I was hoping there's Filter and Sort section on the Layout so I could filter it to top 3 and bottom 3 but it looks like it's a stripped back version of the Layout used in Screens. Do you have an example of the procedure steps needed? This is my current procedure. Step 4 is not finished yet.
The most straightforward way to sort the data would be to do an extract reload, as you have access to all the same functions as you do on a screen layout such as a ranking function. As you extract it you can add the column that signifies position. Then you can read this column in and cut the top 3 and bottom 3 using the 'position' cube you just loaded in. I'll have a think if there is a way to do this without the extract but the above method would definitely work.
Thanks @Edward Ervin ! I'll give this a try