Hi everyone,
I’m building a “Performance globale” screen with several Cartesian charts (line series), and I need to match a design mock-up provided by the business. I’m attaching two images:
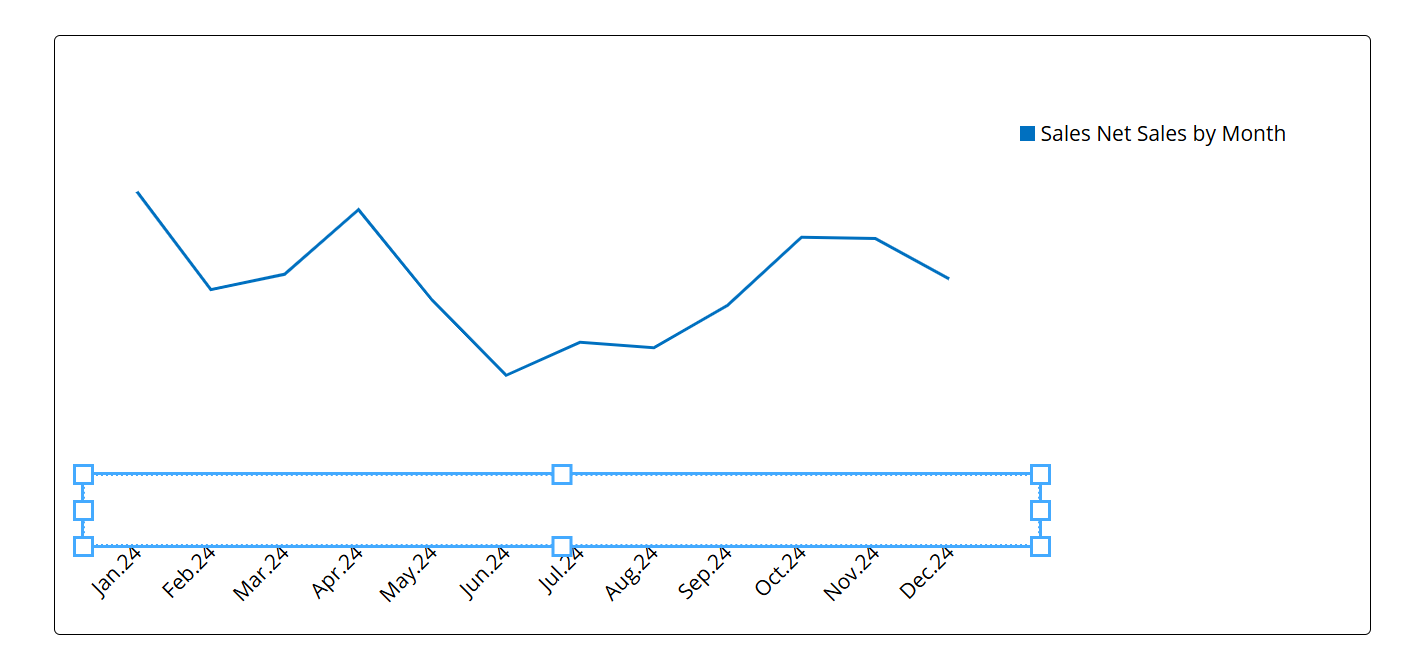
- Image 1: the current result in Board.
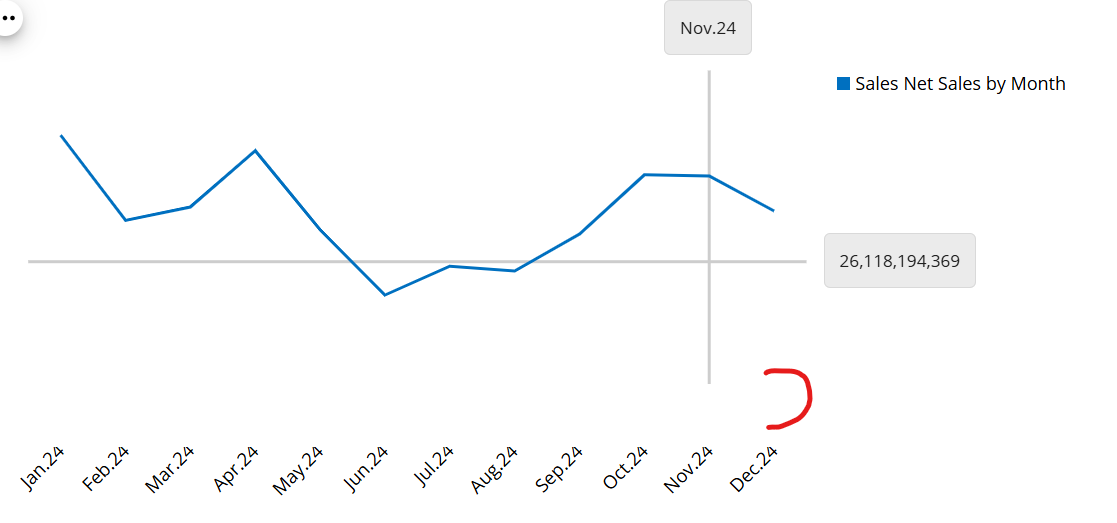
- Image 2: the expected result (mock-up).
Expected result
The category axis shows the month labels (Jan, Feb, Mar…) but no axis line and no tick marks under the chart. The Y axis is not displayed either.
Current result
The Y axis is hidden, but a black horizontal line with tick marks remains under the months (the category axis line). I want to remove only this line and keep the month labels.
What I have tried (without success)
- Data > Axis > Primary > Visible unchecked: the Y axis is hidden, which is fine, but the horizontal line remains.
- Data > Axis > Category > Visible unchecked: the line disappears, but the month labels disappear too, so this is not usable.
- Data > Axis > Category > Show Grid Lines is unchecked and Dash Style is Solid: no effect on the axis line.
- Design > Fonts > Category, color set to green: it only changes the color of the month labels, not the axis line.
- Design > Border, color set to red (rgba(255,0,0,1)) with Type = Solid: nothing changes visually on the chart or on the axis line.
My question
Is there a property, in the Data tab, the Design tab or a theme, to hide the category axis line and its tick marks (or make them transparent or width 0) while keeping the labels visible? If this is not possible today, is there a recommended workaround, or is it a feature request?