Best Of
HowTo: Check which .NET Framework version is installed
The following instructions can help you identifying the exact .NET version installed on a specific machine.
.NET Framework v. 4.5 or higher:
On the Start menu, choose Run.
In the Open box, enter regedit.exe.
You must have administrative credentials to run regedit.exe.
In the Registry Editor, open the following subkey:
HKEY_LOCAL_MACHINE\SOFTWARE\Microsoft\NET Framework Setup\NDP\v4\Full
Note: If the Full subkey is not present, then you do not have a the .NET Framework 4.5 or later installed.
Check for a DWORD value named Release. The existence of the Release DWORD indicates that the .NET Framework 4.5 or newer has been installed on that computer.
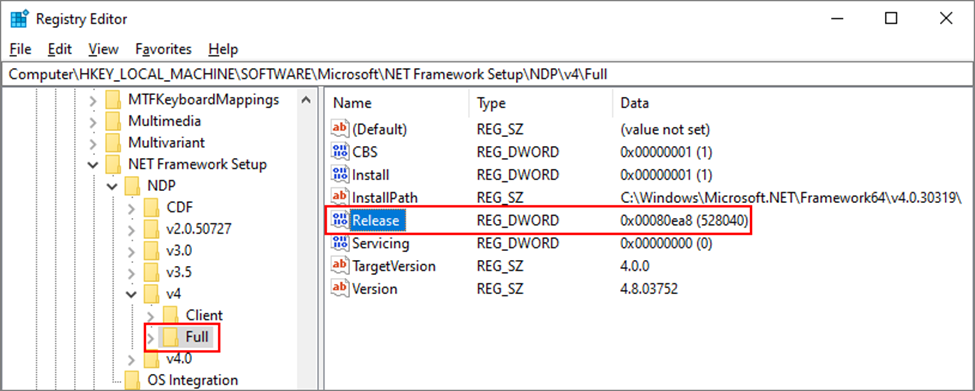
The value of the Release DWORD indicates which version of the .NET Framework is installed.
.NET Framework version | Minimum value |
|---|---|
.NET Framework 4.5 | 378389 |
.NET Framework 4.5.1 | 378675 |
.NET Framework 4.5.2 | 379893 |
.NET Framework 4.6 | 393295 |
.NET Framework 4.6.1 | 394254 |
.NET Framework 4.6.2 | 394802 |
.NET Framework 4.7 | 460798 |
.NET Framework 4.7.1 | 461308 |
.NET Framework 4.7.2 | 461808 |
.NET Framework 4.8 | 528040 |
.NET Framework 4.8.1 | 533320 |
.NET Framework v. 1 to 4:
To find .NET Framework versions by viewing the registry (.NET Framework 1-4)
On the Start menu, choose Run.
In the Open box, enter regedit.exe.
You must have administrative credentials to run regedit.exe.
In the Registry Editor, open the following subkey:
HKEY_LOCAL_MACHINE\SOFTWARE\Microsoft\NET Framework Setup\NDP
The installed versions are listed under the NDP subkey. The version number is stored in the Version entry. For the .NET Framework 4 the Version entry is under the Client or Full subkey (under NDP), or under both subkeys.
Note: The "NET Framework Setup" folder in the registry does not begin with a period.

ROLAP Cubes on Oracle DWH and Timeout issues
This article is intended for all customers using Oracle Datawarehouse to receive information from Board through ROLAP Cubes.
This is applicable also to other Datawarehouses whenever you are encountering timeout issues.
When connecting to an Oracle DWH, timeout is a very important matter.
Usually, Oracle native ODBC take longer time compared to other DWHs to connect, and this could result on queries going in timeout on a large dwh.
This is the case especially on ROLAP Cubes, where Board sends different Insert / Update queries back to the DWH.
In order to have everything working correctly, you need to ensure that query timeout parameters are setup correctly both on Board Connection and on the ODBC.
Following steps need to be applied:
1) Edit the Query Timeout parameter in the Board Connection parameter settings, and set as new value: -1

2) From the ODBC Administrator window of your server, edit the Oracle Connection and unflag the Enable Query Timeout option

In this way, Oracle is forced to receive and complete the full query, avoiding a shutdown of the connection after the standard inactivity time, which for the ODBC is set to 30 seconds, thus preventing a part of the query from being executed