Best Of
Re: What is/are the difference/s between Stop and Kill in the Cloud Admin Portal?
Hi,
as far as I understood stop will end the Application in a controlled way (like stoping the service using BOARD Server config) [i.e. the BOARD Engine can write all data from RAM to HDD], while Kill will end the process immadiatly (without possibity to write data from RAM to HDD). So normally you should use the Stop and only use kill if stop is not working.
Regards
Björn
 Björn Reuber
🎓 Introducing the New Academy Interface
We’re excited to share the launch of the new Academy interface, designed to make learning easier, faster, and more intuitive.
What’s new:
- Seamless access to all learning formats On-demand courses, certifications, and instructor-led trainings are now accessible through a single, streamlined experience.
- Direct access to key resources Navigate straight from the Academy to the Board Community, Knowledge Base, and Support, keeping learning and help closely connected.
- New and enhanced role-based learning paths Learning paths are now organized by role - including Delivery (ProServe), Customers (End User, Power User, Administrator, and more), and Presales - helping you quickly find the most relevant content based on your level and goals. Additional learning paths will be introduced in 2026.
- Faster navigation to enablement content Quick access to Solutions Enablement, Version Release enablement, and Learning Paths helps you stay aligned with what’s new and important.
- Improved search and filtering Enhanced search capabilities make it easier to discover the right courses and content without unnecessary browsing.
- Improved interface design UX/UI updates improve usability and ensure a consistent experience across devices and screen sizes.
▶️ How to Navigate the New Academy Interface
Watch a short walkthrough video that provides detailed guidance on navigating the new Academy interface, including how to find courses, learning paths, enablement content, and support resources.
We encourage you to explore the updated Academy and share your feedback at academy@board.com. Your input helps us continue improving the learning experience.
You might also like
Introducing the New Board Idea Exchange
The Board Idea Exchange is where Board Customers, Partners, and Employees share ideas, provide feedback, and help shape the evolution of the Board platform. It’s a central space for proposing enhancements, discovering what others are asking for, and engaging with ideas that impact how you work.
We built this portal to support open collaboration between our Customers, Partners, Employees, and Product Teams—and to make it easier for your input to be heard, understood, and acted on.
What’s new in the updated Idea Exchange?
The new Board Idea Exchange, available beginning February 2, focuses on clarity, relevance, and usability. Key improvements include:
AI-assisted idea discovery
When submitting a new idea, AI helps automatically identify similar existing ideas, making it easier to:
- Avoid duplicate submissions
- Add your vote or context to ideas already gaining traction
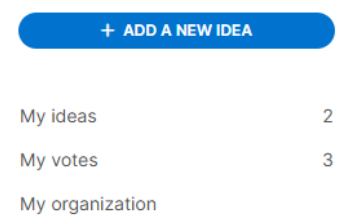
Better visibility into your ideas
You can now quickly find:
- Ideas you’ve submitted
- Ideas you’ve voted on
Your contributions are easy to track in one place.
Organization-level filtering
You can filter ideas submitted by your organization, making it easier to:
- Align internally on priorities
- See what peers in your company care about
- Coordinate feedback and voting
What’s changed (and what hasn’t)?
- Hot Topics are replaced by an option to sort on Recent, Trending, and Popular.
- Focused on helping you find relevant ideas through search, filters, and AI-powered similarity detection.
- Focused on helping you find relevant ideas through search, filters, and AI-powered similarity detection.
- The core idea workflow remains the same.
- You can still submit ideas, vote, comment, and follow status changes via the Subscribe button found on each idea as ideas move through evaluation and delivery.
- You can still submit ideas, vote, comment, and follow status changes via the Subscribe button found on each idea as ideas move through evaluation and delivery.
- The current Community Idea Exchange is in ''read-only' mode until February 2, 2026
- This means that you will not be able to post new ideas or comments to existing ideas as we prepare for the launch of the new Idea Exchange experience
- This means that you will not be able to post new ideas or comments to existing ideas as we prepare for the launch of the new Idea Exchange experience
- A new way to access the Idea Exchange begins on February 2, 2026.
- The new Idea Exchange will have two unique entry points—one customized for Customers and one for Partners and Employees—with a shared experience and combined search for all participants.
- To log into the new Idea Exchange, follow the navigation at the top of Community and log in using your existing Community credentials.
- Registration in the Community is required for Idea Exchange access.
- Submitted ideas will now be listed under your profile in the new Idea Exchange.
- No new badges will be awarded in the Community for posting in the new Idea Exchange. However, existing badges earned in Community will remain as is.
- Search will now be unique to the Idea Exchange and will not return any results in Community.
How do I submit an Idea?
- Open the new Idea Exchange using the link found at the top of the Community and log into the Idea Exchange.
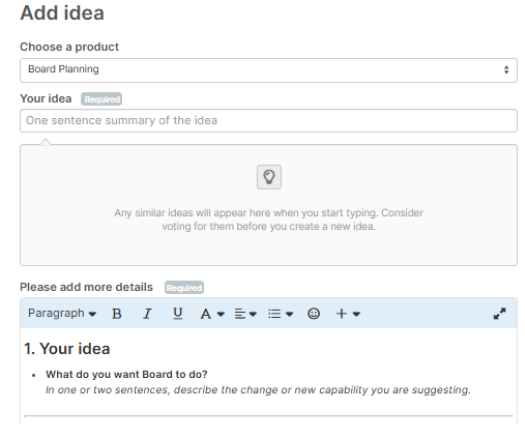
- Click +ADD NEW IDEA to submit a suggestion.
- Select a Product for your idea, choices are Board Planning, Foresight, Signals.
- Add a clear one sentence summary, any similar ideas will appear in the window below.
- Review AI-suggested similar ideas.
- Describe your idea, and upload attachments.
Vote, subscribe or comment on an idea
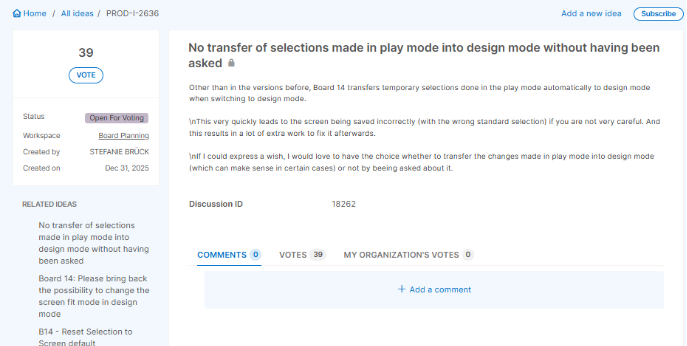
- Click to open an idea and use the voting button to add your vote. Each user is limited to one vote per idea.
- On the lower left pane, view related ideas.
- At the upper right corner, click to subscribe and receive email notifications of changes in status.
- Click + Add a comment at the bottom to share your thoughts.
What do idea statuses mean?
- Open for Voting – Newly submitted and open for feedback
- Under Review – Has reached 25 votes and is being considered by Board Product Management
- Accepted – Reviewed and under evaluation by the product team
- Planned – Approved and scheduled on the roadmap
- Shipped – Delivered and available to customers
- Already exists – Functionality is available in the product
- Archived – No longer active (see archiving policy below)
How does Board decide which ideas move forward?
Ideas are evaluated using multiple inputs, including:
- Votes from the community
- Alignment with customer needs and market trends
- Product strategy and technical feasibility
If an idea is archived, it doesn’t mean it wasn’t valuable. Ideas may be combined, re-scoped, or addressed as part of broader initiatives. You may see your idea merged with another idea, this allows us to combine similar ideas and add all the unique votes.
For example:
Idea A – 5 votes from people (a,b,c,d,e)
Idea B – 4 votes from people (e,f,g,h)
After merging ideas A and B there will be 8 unique votes from people (a,b,c,d,e,f,g,h). The vote from person e is not counted twice.
How often are ideas reviewed?
Our product teams regularly review and update ideas, with status changes shared transparently whenever possible. Community input is an ongoing part of how we refine priorities and plan future investments. When an idea reaches 25 votes, it will be placed Under Review and a response or clarification will be provided by the product management team resulting in the idea moving to Accepted, Already exists or Archived.
If you have an idea that has been Accepted, this is not a guarantee that it will be delivered, or that if delivered it will match your suggestions exactly.
Idea archiving policy
To keep the Idea Exchange focused and usable:
- Ideas with 10 or fewer votes that are older than six months may be archived.
This helps surface the most relevant and actively supported ideas while maintaining visibility into past discussions.
Your voice still matters
The new Board Idea Exchange is designed to make your input easier to share, easier to find, and easier to act on. We value your feedback and encourage you to continue submitting ideas, voting, and engaging with the Community.
Your ideas help shape what we build next.
Notes on Idea Migration
As part of the transition to the new Board Idea Exchange, we migrated ideas from the previous Idea Exchange with the following scope and considerations:
- Only active ideas were migrated. Ideas that had already been archived in the previous portal were not carried over.
- Original authorship may appear as “Guest” in cases where the user who submitted the idea is no longer an active community member.
- Vote counts were preserved. All existing vote totals were migrated.
- Voter attribution may be limited. In some cases, votes could not be linked back to currently active user accounts, though the total number of votes remains accurate.
These steps ensure continuity of ideas and signal while aligning the new portal with the current Community membership.
 Miran Saric
Date Selection Display - Selector
Hello,
Please can we change the behavior of Selector's Show Active Members - At their position or add a New option to show selected month at their position and automatically scroll to that position instead of showing all months in increasing order i.e. very old months on top.
This would ensure that the selected month and relevant months (which most likely will be the months nearest to the current selection) will be the first shown and not super old months (historical).
The Grouped at the top option doesn't work as well since it will show the selection at the top but the next months will be the historical months again.
This will positively impact user's experience when using the selector since it's showing the most relevant items by default without needing to scroll or search everytime.
Proposed Default View when selector is opened
Current default view (needs to scroll to the selected month)
Re: DOWNLOAD NOW! Take on Board 2025–2026 Report: Your Feedback in Action
Great example of closing the feedback loop, exciting to look ahead to what 2026 brings 🙌
Sorting Columns On Fix/Enhancement
Hello,
It would be great to be able to use the Sorting Columns On functionality while using a Detail By in the layout. Currently, when a Detail By is activated, the whole function is disabled.
From GCR to FCR: A Name Change That Reflects How Finance Teams Work
Names matter, especially when they describe how finance teams actually work.
That’s why we’re making a small change that better reflects how many of you use Board.
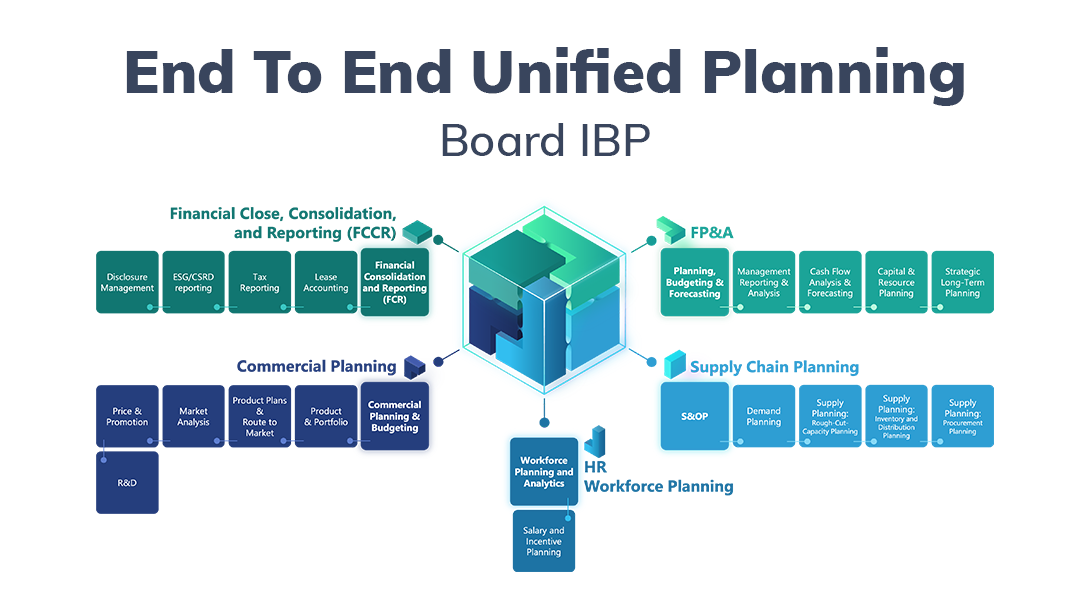
As of today, we’re renaming our solution area from Consolidation and Reporting GCR (Group Consolidation & Reporting) to FCCR (Financial Close, Consolidation, and Reporting) to better reflect the capabilities you rely on, especially as we prepare for the upcoming launch of our FP&A and Controller AI agents.
As part of this update, the use case currently known as Group Consolidation and Reporting (GCR) will be renamed Financial Consolidation and Reporting (FCR).
This is a name change only. There is:
- No impact on your current setup
- No change to access, data, or functionality
- No change to contracts, pricing, or roadmap
You’ll simply see the new names FCR or FCCR reflected in the user interface, documentation, and related materials going forward.
FCR represents the natural evolution of GCR—rebuilt on the latest Board Platform with an optimized UX/UI to provide access to the latest financial consolidation capabilities.
Pricing and upgrade entitlements remain unchanged. Please note that FCR is applicable on Board version 14.5 or higher. It is recommended that customers upgrade to the latest version of Board to take full advantage of the latest features and functionality.
This update better reflects Board’s financial close, consolidation, and reporting capabilities—now and in the future—and aligns with how finance organizations commonly describe this process.
To keep things easy, we’ve added a short FAQ below that covers what’s changing and, just as importantly, what isn’t.
No action is required from your side. If you have any additional questions, we’re here to help.
FAQ:
1. What is changing?
We are changing our solution area name from Consolidation & Reporting to FCCR (Financial Close, Consolidation & Reporting). As part of this solution area name update, the solution currently known as Financial Consolidation (GCR) is now renamed Financial Consolidation and Reporting (FCR).
2. What’s the reason for this change?
The name FCCR more accurately reflects:
- The comprehensive close, consolidation and reporting process supported by Board now and in the future.
- Our expansion into richer reporting, compliance, and automation capabilities with new UX/UI to align with FP&A assets and FlexGrid in specific areas to enhance user experience.
- The terminology used by CFOs, Controllers, auditors, and global finance teams.
3. Will anything change in the user’s experience?
No. This is a name change only for the FCR use case and our product formerly called Group Consolidation and Report (GCR) — nothing functional is changing. The only changes customers will notice:
- UI labels updated to FCR
- Navigation/menu name changed
- Updated terminology in documentation
- Updated screenshots and icons
4. Does this impact pricing, licensing, or contracts?
No. All agreements and entitlements remain unchanged.
5. Will user access, roles, integrations, or data be affected?
No. Functionality will continue to work exactly the same as it does currently.
6. When will we see this change?
The rename is effective from January 20, 2026. New Customers will see FCR in the UI and documentation starting from that date. Existing GCR customers must upgrade the solution (requesting the package via ticketing system) to see the updated UX with the renamed FCR use case. Please note that Board 14.5 is required.
7. Do we need to take any action?
Customers that want to upgrade to FCR need to open a ticket and request the update package.
8. Are there any use case changes or roadmap updates tied to this change?
No. The FCR introduces new features but please refer to the release note will make available post launch. The roadmap remains the same.
9. Do audit or compliance workflows change?
No. All audit trails, controls, and reporting logic remain exactly the same.
DOWNLOAD NOW! Take on Board 2025–2026 Report: Your Feedback in Action
Those that have met me can appreciate how ensuring that Board remains customer-driven is so important to me and everything we do. To that end it gives me great pleasure to announce the second edition of Take on Board – Customer Experience Report 2025–2026 which is, yet again, — built entirely on: your feedback.
Over the past year, you told us what was working, what wasn’t, and where we needed to raise the bar. We listened — across surveys, Community conversations, Board Beyond events, Customer Success reviews, and day-to-day interactions — and we acted.
This report shows that clearly:
You said → We did → What this means for you.
Why it’s worth reading
Customers
You’ll see how your feedback directly shaped:
- A calmer, more reliable platform with smoother upgrades and stronger governance
- Predictive insight that fits your workflows, through Board Signals and Board Foresight
- A more consistent Customer Success experience, focused on outcomes, not activities
- Faster answers and stronger enablement across Community, Academy, Support, and Knowledge Base
Partners
You’ll get clarity on how we’re strengthening the ecosystem, including:
- Capability-based partner tiers and solution-aligned badging
- Stronger delivery standards and quality checkpoints
- Earlier, deeper co-delivery with Customer Success
- A shared focus on predictable delivery and measurable outcomes
What’s next
Looking ahead to 2026, our focus is clear:
- Reliable, low-touch upgrades
- Deeper AI driven insights
- Seamless Signals + Foresight integration
- More proactive, AI-assisted support
- Learning and guidance available in the flow of work
- A partner ecosystem built around outcomes
One takeaway
Your feedback is driving real change.
Thank you for your trust and partnership.
We’re listening, we’re acting, and we’re building what comes next — together.
👇️ Download your copy of the Take on Board – Customer Experience Report 2025–2026 below and tell us what resonates.
#customerexperience #CX #TakeonBoard #Board #customersuccess #feedbackmatters
Screen Designer Improvement: Selection helper for stacked object
Now that we have a 2nd button, it would be very useful that when right clicking in the page, you have a section in the menu called "Selection helper" where you can find the list of all object that are under the your cursor when you left click.
Exemple:
Screen Designer Improvement: Highlight object when hover in Layers
When hovering an object in the screen designer it would be of great help if the object under the cursor was highlighted with an orange selection (instead of default blue) so you could easily identify what object if is you are hovering when they have no name or a generic one :


